Introduction
We will investigate the importance of converting Date column to datetime format.
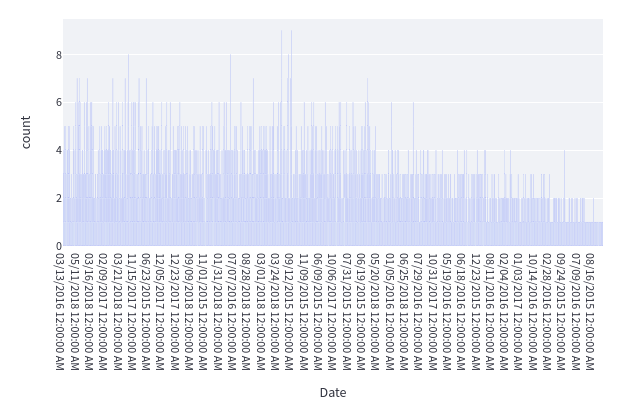
If we have a Date column which is not datetime format but stored as strings, then
plotly will plot all date values. As you see, it leads to cluttered output.
The reason is the dates in the Date column are not in datetime format.
import plotly.express as px
px.bar(df, x='Date')
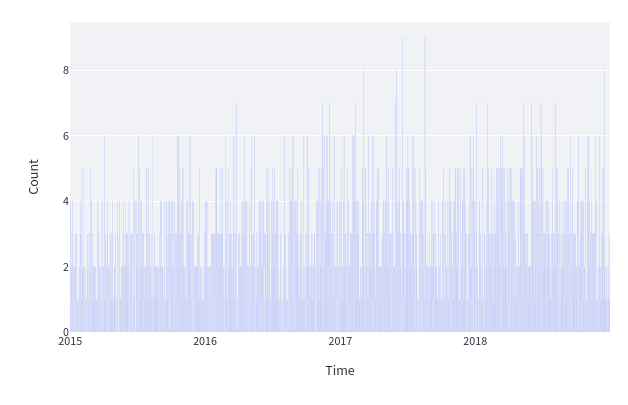
To get a cleaner timeline style look, we should convert Date column to datetime format.
import plotly.express as px
df['Date'] = pd.to_datetime(df['Date'])
px.bar(df, x='Date')
The result is a clean x-axis labelled at regular intervals.